(published July 2015)
The primary method of weather routing underway these days is based on vector wind forecasts in GRIB format displayed in echart navigation programs. Navigators who do not display the data directly in an echart program still use this data viewed in separate GRIB viewer software. One popular free program, and data source, is the WinFax program from Saildocs that includes both the GRIB viewer and a convenient link to download the data via email using HF radio or satellite phone when underway, or by Internet when available. Commercial products from Ocens, Expedition, and others offer expanded features and convenience.
The primary source of free data used in these programs, is the numerical prediction forecast of the Global Forecast System (GFS) model from the National Weather Service (NWS). This is free, worldwide data. There are other (regional) model output options for selected regions that can sometimes improve on the GFS forecasts in some coastal waters, but once offshore, we must rely on a global model. There are global model data from other nations that are as good or nominally better than the GFS, but these are not free data. There is also free global data from the US Navy (NAVGEM, formerly NOGAPS), but this would rarely be an improvement over the GFS.
The GFS model offers new wind forecasts every six hours, in three hour steps, out to 10 days. However, none of the models are dependable on the level a sailing navigator might want beyond about four days (96 hours). The latest GFS model computes wind at grid points of 0.12 degrees, but this high resolution is so far not typically available to sailors at sea. The most common sources of GFS data provides a wind vector every 0.5 degrees, or about every 30 nautical miles, depending on latitude. The racing tactics program Expedition is the only one I have seen that offers GFS data down to a 0.25 degree grid.
But here is the ongoing issue for those who want to do the best they can in wind forecasting. The GFS data are pure computer model output. The data you get this way, has not been vetted in any way by human meteorologists once it left the computer. That is not to say it is wrong. The computational science of the atmosphere is improving every year and is remarkably good artificial intelligence. In fact, the GFS winds will be very close more often than very wrong, but they can indeed be wrong, and can indeed be close, but not right, especially as we get beyond 48 hours.
So what do we do about this to optimize the forecasts? First, we must remember that we do indeed have the actual forecasts from professional meteorologists. We get these forecasts from the folks at the Ocean Prediction Center (OPC) and the National Hurricane Center (NHC). We also have regional forecast offices in Honolulu (HFO) and Alaska (ARH).
They provide (via Internet links or HF retransmission via USCG) surface analysis maps every six hours, as well as a 24 hour forecast and 48 hour forecast every 12 hours, and a 96 hour forecast every 24 hour. Thus we can compare their forecasts with what we see in the GFS forecasts as a way to judge if the GFS has withstood the scrutiny of the professionals. These meteorologists have, in preparing their own forecasts, studied all of the global models available, several of which are ranked higher than the GFS in overall performance skill. To make their judgments they include various ensemble studies of the models, which include looking at the output at a specific time based on different initialization times, as well as different input data. They can also vary the physics parameters of the solutions. The extent to which the results are independent of these variations in the calculations directs them to the best model to use for the situation at hand.
They also fold into this their experience with the climatic behavior in various regions as well as past performance of the models in particular circumstances. They can also use their experience to evaluate the ship and station observations that have seeded the models for the latest run. They may have access to satellite wind and cloud image data that did not happen to show up in time to be assimilated into the last computation. In short, the background that goes into the forecasts they make is far more than just the output of one particular computer model, so we have every reason to believe that they could provide a better forecast.
With that said, we must add that the difference between what the meteorologists provide and what the GFS model alone provides depends on what part of the world you are in and when. Our recent study of this, for example, for the Transpac route, LA to Honolulu (during the summer) with a nicely formed and in place Pacific high, showed very little difference between human forecasts and pure GFS model predictions. In such cases, the NWS will indeed simply use the pure GFS themselves to create the isobars and subsequent wind fields.
But when things are not so benignly climatic, or at higher latitudes much of the time, the differences can be significant and it is our job as prudent navigators to make the comparison before relying on the GFS alone. Also, we know the global models are not dependable near the coast, whereas it would seem the NDFD would be more reliable there as these are the same folks making the coastal forecasts.
Up until late last year, the process of comparing the two forecasts when underway was rather tedious, because the NWS forecasts were only available as graphic images of the weather maps. Thus we had to plot various positions on these and then extract the wind and pressure data using special tables. These data could then be compared to the GFS values for the same forecast times. The process and required tables are in the textbook Modern Marine Weather. But now, we have a new digital solution that for many parts of the world not only offers an easy solution but in effect diminishes the requirement for the comparison in some cases.
The answer is NDFD (National Digital Forecast Database) which is the vectorized versions of the NWS forecasts, which are now in a GRIB format that all mariners can download and run in their standard GRIB viewing software. The raw data is readily available online, but in a complex format that requires special programs to interpret. Afterwards, it must be converted to the “.grb” format that mariners are used to. There may be other sources, but the only one I know of is an email request to Saildocs; and we are very grateful to them for providing this service. This option is not included within the WinFax Get Data option, but it can be obtained by email request to query@saildocs.com with this in the body of the message:
SEND NDFD:50N,45N,130W,120W|0.12,0.12|0,6..120
This message can be varied with the standard SailDocs conventions for region, and forecast span. The forecasts are available every three hours out to 72 hours, and then every six hours out to 168 hours (seven days); however accuracy beyond 96 hours cannot be counted on regardless of who produced it. The longer run forecasts are still useful on some level for weather routing programs that must look ahead at something to make proposals for earlier times.
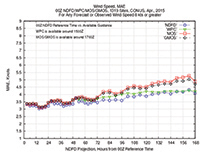
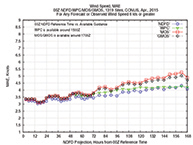
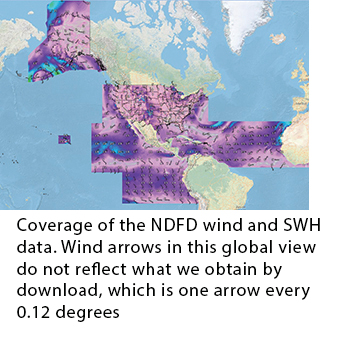
The resolution of the data is very high at 0.12 degrees, which corresponds to roughly one wind arrow every seven nautical miles, which is about four times finer grid than typical GFS data. A drawback for barometer oriented navigators like myself, however, is the absence of isobars. For now from the NDFD we just get wind speed and direction and significant wave height (SWH) for use at sea. The database itself includes air temperature, humidity, and various other land oriented data.
What we do not have yet and very much would like to see is that part of the NDFD that covers tropical cyclone surface wind forecasts of winds greater than 34 knots, greater than 50 knots and greater than 64 knots. Unlike sea level pressure, these data are all in there already, but not yet available to mariners in conventional GRIB format.
The other limiting factor of NDFD is the data are not available worldwide. The borders do not have to be spelled out in the Saildocs request. That service will simply provide what is there within whatever you ask for. I have been told by the NWS that it is on the planned expansion to extend the coverage from 140W on over to HI, but with such tight budgets these days we don’t know when that will happen. The first step is we need more vessels using it to learn of its value so we have more folks asking for it.
This data set is a major breakthrough for sailors. It now covers a large extent of our sailing waters, and if the planned expansions go through it could be the main source of data for cruising and racing sailors in transpacific and transatlantic sailing. The key point here, is that in principle the NDFD forecasts includes the skill of the ECMWF and UK Met models, which are ranked the top two numerical prediction programs. As we read in the official Forecast Discussions that accompany every forecast made by the NWS, oftentimes the NWS defers to one of these models for their forecasts. Whenever this happens we get that benefit in the NDFD. Normally only the boats with expensive contracts with private agencies have access to that data.
Also, on the horizon is a new program called National Blend of Global Models Project (NBGMP). This will be an improved forecast system using both NWS and non-NWS models, along with state of the art ways to evaluate input observations plus enhanced ongoing verification to produce a top of the line forecast product. This work is for now focused on land based forecasts, but it will be extended to the ocean as well, and we will then have digital access to through the NDFD. The US did after all invent the concept of numerical weather prediction, so it looks like we may be working toward regaining that leading role.
David Burch is the director of Starpath School of Navigation, which offers online courses in marine navigation and weather at www.starpath.com. He has written eight books on navigation and received the Institute of Navigation’s Superior Achievement Award for outstanding performance as a practicing navigator.
Reference websites
SailDocs www.saildocs.com
Ocens www.ocens.com
Expedition www.expeditionmarine.com
Modern Marine Weather www.starpath.com/weatherbook
NWS Marine WX www.weather.gov/marine


