The 34-kt Rule and the Mariners’ 1-2-3 Rule (published January 2013)
The tragic sinking of the tall ship HMS Bounty and the loss of two lives on October 28, 2012 in the winds and seas of a very well-forecasted storm forced me to postpone my promised article on the pros and cons of e-chart types, and instead go over the guidelines we have for safe navigation in the presence of tropical storms. But first, an acknowledgement that all mariners are grateful for the courage and skill of the USCG men and women who risked their own lives to rescue the 14 crewmembers of the Bounty who were at the site when the helicopter got there.
In Modern Marine Weather, we point out that if you want to sail in a hurricane you can. We know where they take place and when they take place—and when they do occur, their location and projected tracks are remarkably well forecasted. To sail in one, just look up this information and go there. On the other hand, if you do not want to sail in a hurricane, look up the same information and then do not go there.
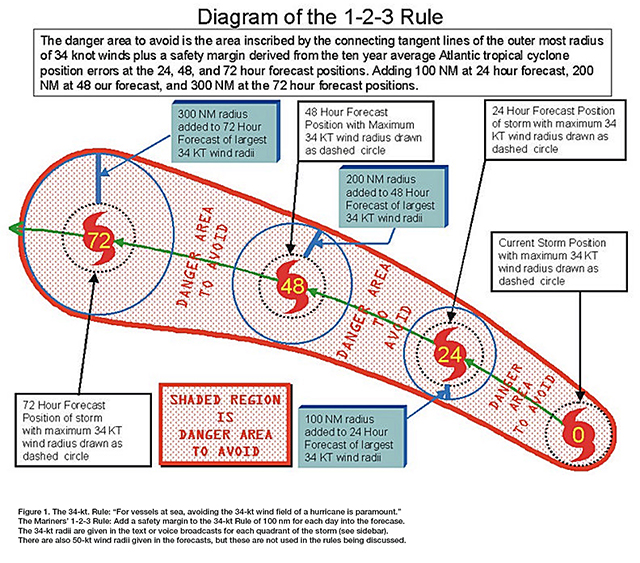
Seems simple enough, but this nutshell summary of avoiding hurricanes is obviously oversimplified. Huge areas of the ocean and long seasons would be blocked out by such a simple guideline. Fortunately, the National Hurricane Center (NHC), in collaboration with the US Navy and other experienced mariners over the years, has come up with more realistic guidelines for safe navigation in the presence of tropical systems. It comes in the form of two simple rules: The 34-kt Rule and the Mariners’ 1-2-3 Rule.
The 1-2-3 Rule is simple and easy to apply based on text or voice reports of the storm locations, which are given several times a day in the high-seas broadcasts. Namely, the danger area to be avoided expands the forecasted danger zone by 100nm per day, as shown in Figure 1.
The danger zone for this application is characterized by the NHC as the radius around the storm center that includes winds greater than 34 knots. Thus, we start with what the NHC calls the 34-kt Rule: “For vessels at sea, avoiding the 34-kt wind field of a hurricane is paramount. Thirty-four knots is chosen as the critical value because as wind speed increases to this speed, sea state development approaches critical levels resulting in rapidly decreasing limits to ship maneuverability.” They add the natural precaution that sea state outside of the 34-kt radius can also be significant enough to limit course and speed options, so we should monitor this carefully.
We can use the forecast of Hurricane Sandy on Thursday, October 25th (see sidebar) as an example of a long-term forecast for a storm headed north.
Plot the location of the storm at forecast time, and then plot on your chart the forecasted locations on day 1, 2 and 3. Then check the forecast for the maximum radius of 34-kt winds. They are given for each quadrant on each day’s forecast. On day 1, this was 150 nm, which occurred in the NE quadrant. With a drawing compass draw a circle around each of the three locations with 34-kt radii (in this example) of 150, 250 and 300 nm. You then have a plot of forecasted storm sizes on these three days, which is shown in Figure 2.
These are not the safety zones of the 1-2-3 Rule—these are the actual forecasted locations and sizes of the system that should be avoided. Next, we apply the Mariners’ 1-2-3 Rule to account for uncertainties in forecast accuracy.
To each of these 3 radii, we then add 100, 200 and 300 nm to account for historic uncertainty in the forecasted track. This guideline is based on the NHC’s records over the past 10 years of errors in forecast track location. The track locations are actually more precise than this in recent years, and indeed getting better continually, but the uncertainty in intensity and size of the forecasted systems remains more of a challenge and hence the larger safety zones.
Furthermore, this guideline as presented is for tropical systems that are fueled from the warm water below them. Once a storm moves out of the tropics and becomes extratropical, it begins to gain energy from a much broader source—the temperature difference between cool northern air and warmer southern air masses. When this happens, the system can quickly become much larger and more intense. This is precisely what happened with the transition between Hurricane Sandy and Superstorm Sandy. It got much larger, with a much broader band of strong winds and high seas.
Sandy became known in the media as a “superstorm” (not a defined meteorological term) because that transition took place at a time that was uniquely favorable to enhanced extratropical development. Extratropical storms on the surface are strongly influenced by the wind patterns in the upper atmosphere, and this one just happened to move north at the worst possible time—not only for enhancement, but for a forced turn to the west, rather than the more normal route to the east. This, however, was not a surprise. The storm was indeed a testimony to the skill of modern numerical weather prediction, which had accounted for these effects. They were included in the forecasts as shown by the examples here.
In short, we should not look at the 34-kt Rule and the Mariners’ 1-2-3 Rule as an over-conservative guideline. It was spot-on in the case of Sandy, with tragic consequences for the HMS Bounty.
NWS NATIONAL HURRICANE CENTER MIAMI FL
0300 UTC THU OCT 25 2012
[Day 0 – Thursday]
HURRICANE CENTER LOCATED NEAR 19.4N 76.3W AT 25/0300Z. POSITION ACCURATE WITHIN 20 NM
PRESENT MOVEMENT TOWARD THE NORTH OR 10 DEGREES AT 11 KT. ESTIMATED MINIMUM CENTRAL PRESSURE 954 MB. EYE DIAMETER 20 NM. MAX SUSTAINED WINDS 80 KT WITH GUSTS TO 100 KT.
64 KT……. 25NE 20SE 20SW 20NW.
50 KT……. 50NE 60SE 40SW 40NW.
34 KT…….110NE 120SE 70SW 60NW.
12 FT SEAS..120NE 300SE 120SW 120NW.
WINDS AND SEAS VARY GREATLY IN EACH QUADRANT. RADII IN NAUTICAL MILES ARE THE LARGEST RADII EXPECTED ANYWHERE IN THAT QUADRANT.
[Day 1 Friday]
FORECAST VALID 26/0000Z 24.4N 76.2W
MAX WIND 70 KT…GUSTS 85 KT.
64 KT… 20NE 20SE 0SW 0NW.
50 KT… 70NE 70SE 40SW 50NW.
34 KT…150NE 120SE 70SW 90NW.
[Day 2 Saturday]
FORECAST VALID 27/0000Z 27.6N 77.2W
MAX WIND 65 KT…GUSTS 80 KT.
50 KT…120NE 100SE 90SW 120NW.
34 KT…250NE 160SE 100SW 230NW.
[Day 3 Sunday]
FORECAST VALID 28/0000Z 30.5N 74.5W
MAX WIND 60 KT…GUSTS 75 KT.
50 KT…120NE 120SE 120SW 100NW.
34 KT…300NE 270SE 180SW 300NW.
EXTENDED OUTLOOK. NOTE…ERRORS FOR TRACK HAVE AVERAGED NEAR 175 NM ON DAY 4 AND 225 NM ON DAY 5…AND FOR INTENSITY NEAR 20 KT EACH DAY.
[Day 4 Monday]
OUTLOOK VALID 29/0000Z 33.5N 71.5W
MAX WIND 60 KT…GUSTS 75 KT.
[Day 5 Tuesday]
OUTLOOK VALID 30/0000Z 37.0N 70.0W…POST-TROPICAL
MAX WIND 60 KT…GUSTS 75 KT.

In this storm, it was well forecasted that the hurricane would turn extratropical, expand and intensify, so the 34-kt Rule alone blocked off essentially all of the coastal waters before even applying the 1-2-3 Rule. The 1-2-3 Rule showed how far out to sea the risk extended and remained a valuable guide to mariners in the waters off Florida for several days. Figure 3 shows this extra caution was justified.
The diagram shows the forecast at the time of departure. The inevitability of the encounter with the 34-kt wind field did not diminish with time.
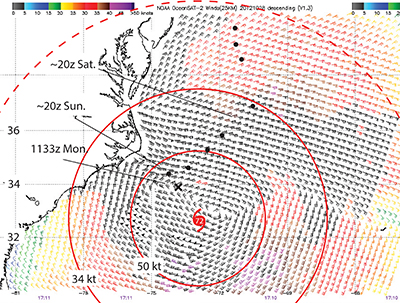
The 50-kt wind field was very well forecasted, and for the most part the 34-kt winds as well. But there were large regions of the ocean beyond that 34-kt radius that had winds well above 34-kt, which shows the value of the 1-2-3 Rule. That rule at 72 hours off calls for a large clearance in such a large storm. For storms within the tropics the 34-kt wind range might not be as large, so maneuvering options could be better, but tropical storm sizes do vary significantly within the tropics.
The NHC website publishes the 1-2-3 Rule boundaries for all storms they track, so watching these online is a good way to get a feeling for how they evolve.
The satellite data here are from the Indian scatterometer OceanSat2 (OSCAT). The European instrument ASCAT is a primary source for this type of data, but it did not have a pass at this time. The sections it did show confirm that the winds were at least as strong as shown here. We have made a link to all of the scatterometer data along with a convenient way to get ASCAT winds by email at www.starpath.com/ascat.
