(published July 2012)

Current flow within a few miles of a coastline is usually the result of a complex set of forces. Contributing factors include tidal current, wind-driven current, prevailing offshore ocean circulation, river runoff, water depth, and local currents running parallel and perpendicular to the shoreline caused by the surf. Unusual hydraulic currents also might flow along a coastline following long storms that pile up water against a turn in the coastline. These hydraulic currents can occur with no wind, no waves, nor any tidal changes, as the sea-surface slope readjusts to calm conditions. Near headlands, bays or entrances to inland waters, the coastal flow also is strongly affected by the shape of the coastline.
Because so many forces influence the flow, it is difficult to predict coastal currents of interest to small-craft navigators without local knowledge. Nevertheless, these currents are important to navigation because they can severely hinder progress along routes exposed to sudden weather changes. The height and direction of swells can also change in a few hours with no change in local weather, as wave remnants of distant storms first reach the coast. Coastal currents can vary significantly in speed and direction at any one location and vary rapidly and irregularly from point to point along a coast. Although in many areas the currents farther offshore (off the continental shelf) are fairly well understood and documented in Sailing Directions, it is questionable whether much of this knowledge gained from extensive traffic of larger vessels farther offshore can be extrapolated shoreward into regions of soundings well onto the continental shelf (depths less than 100 fathoms).
Because there is so little data for the region that lies between the surf zone and the shelf, it is important to measure the current yourself as often as possible when traveling along close-in coastal routes. It might then be possible to correlate this information with the state of the tide, wind speed and direction, lay of the land, and state of the surf, and gain some insight into the local current behavior that might help plan the rest of the trip. Nearshore current is a difficult subject in oceanography. When dealing with currents in these waters, your surprise threshold must be fairly high.
The tidal part of coastal current is typically rotary as opposed to the reversing currents found on inland waters (Fig 1). Pure rotary current changes directions without changing speed, so there are no slack waters. Current Tables, Sailing Directions and some nautical charts provide diagrams that can be used to predict the speed and direction of rotating tidal currents based on the times of high and low tides at coastal reference stations. Examples are shown in Fig 2. Tidal currents in coastal waters rarely exceed 1 or 2 knots, and well away from the entrances to inland waters, the average values are much smaller—although as with all currents, coastal currents accelerate near headlands and diminish at the mouths of bays. There is also often enhanced and erratic current behavior near the continental shelf. For several reasons, a coastal route is usually better well onto or well off of the shelf, rather than following along its edge.

The tidal current rotations are also not purely circular near long open coastlines. The current direction does rotate (clockwise in the Northern Hemisphere) through 360° every 12 hours or so, but the rate of rotation is not uniform and the speeds are not exactly the same in all directions. Most tidal streams well removed from inlets into inland waters flow faster and longer parallel to the coastline than perpendicular to it. Their rotation diagrams are not circles, but ellipses with the long axes lying parallel to the coastline. Near entrances to inland waters, on the other hand, the ellipses are more aligned with the inlet due to the flow in and out of the waterway.
In many areas, however, the rotary tidal flow is completely masked by wind-driven current whenever the wind blows steadily for half a day or longer. Expect this contribution to be approximately three percent of the wind strength, directed some 45° to the right of the wind direction in the Northern Hemisphere. Wind-driven currents tend to be stronger in heavy rains because brackish water slips more easily over the denser salt water below it. If Sailing Directions predict north-flowing currents of 1 or 2 knots, for example, expect the stronger end of the prediction when the wind blows toward the north and the weaker end of the prediction when the wind blows toward the south.
When waves strike the shore diagonally, they set up a current along the shore, inside the surf zone, flowing in the general direction of the wave motion. These currents inside the surf zone are not strong—0.5 knot might be typical for large waves—so these currents would rarely have direct influence on navigation. Nevertheless, water accumulated shoreward of the surf zone has to periodically escape seaward forming large rip current cells that can contribute to the prevailing flow outside of the surf.

Although nearshore coastal currents are difficult to predict with much dependability, every effort should still be made to establish the range of potential currents when planning coastal routes. Tidal Current Tables help in some locations, but Coast Pilots and Sailing Directions are the primary references in many areas. Whenever possible, also check with local fishermen who work both on and below the surface. In some areas, for example, commercial divers (who gather sea urchins, abalone, geoduck, kelp, herring roe or sea cucumbers) are an excellent resource because they work daily in precisely the waters you might cruise, and they are aware of the current under many circumstances. Sport divers contacted through local diving shops might also be a source of local knowledge. Sailing or navigation schools that do regular tours in an area you might visit are naturally the best source when available.
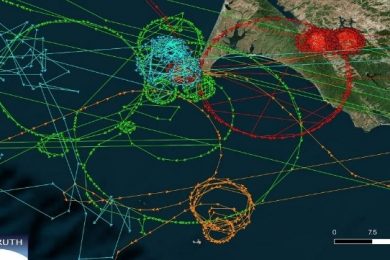
There are ocean model predictions that might help in some waters. The best example I know of is presented in the Nanoos project for waters off the coast of Oregon (Fig 3), which is a model prediction enhanced by coastal radar observations. Unfortunately, there are not many places with such good data. Output from the Global HYCOM model is available from several sources, some showing coastal waters (Fig. 4). The Navy has good data available to the public for Southern California, Gulf of Mexico and Florida, and northward following the Gulf Stream, but that is then farther offshore. If you do find a model output online for near coastal waters (there are several) then I would compare what they predict for the Oregon coast with the Nanoos data to help you evaluate their potential usefulness.
Another place to check model output would be any of the PORTS (Physical Oceanographic Real-Time System, tidesandcurrents.noaa.gov/ports.html) locations where there are buoys with current meters giving actual measurements.

Many mariners are already relying way too heavily on direct atmospheric model output for wind data (“GRIB weather maps”), without comparison with vetted maps and forecasts, but to do so with the ocean models is an even farther leap. We might argue that the GRIB wind forecast is better than none at all, but this might not be true with an unvetted model output for coastal currents! Ocean modeling not only depends on the accuracy of the atmospheric models, they also get (rough guess) less than 10% of the input data needed to pin the models down to known values.
In short, there is still a role for the navigator to use the best known data and principles to estimate the currents when no GPS is available, or to interpret and plan around what we learn from the GPS when we can measure the current effect on our progress.
